Kennan does what an analyst does: pulling data from files and data rooms, conducting the research, building the business case, producing the presentation. A week's work, finished in hours.
Try the slider. Services growth moves the cash flow and the memo with it.
kennan / halcyon / fy26-28-planv.02 · draft
§ 2 · Plan
The FY26–FY28 operating plan, anchored to the FY25 close¹ and the FY26 budget, projects free cash flow rising from $81M in FY26 to $111M² in FY28 — driven by the mix shift to services as the recurring tail outgrows the equipment line.
The plan turns on the services ramp. At an FY26–FY28 services CAGR of 15.0%, FCF lands at $111M; each percentage point lifts FCF by ~$3.7M. Equipment held at 5% per the channel forecast; the plan pack carries the upside and downside cases.
¹HAL_FY25_close.xlsx · Segments tab
²halcyon_plan_v1.py · stored program
The problem Kennan solves
Analysts are hired to think. Most of the week goes to everything else.
Before anyone can think, the numbers have to be pulled together, the model built, the presentation produced. By the time that is done the week is mostly gone, and the thinking gets whatever is left.
01 · Clean data~ days
Sales by market in CSV. Payroll as PDFs with merged cells for titles. All to be consolidated and extracted before the model can start.
02 · Modeling× every scenario
Revenue is built from drivers, by business line and by market — not one growth rate. Three scenarios means three Excel files; comparing them means a fourth tab.
03 · Present~ a day
The model finally settles after many ping-pong iterations. Then the deck: graphs from Excel, boxes aligned in think-cell or PowerPoint, commentary written by hand.
Where the analyst week goesillustrative · 100% of one week
Cleaning data
Modeling revenue
Building the deck
Thinking
The work the case turns on is the smallest slice, because everything to its left has to happen first.
Then the strategy meeting hits: “what if the average price users are willing to pay is 20% lower?” The answer comes hours later, or from a calculator on the table.
And that assumes you have an analyst at all.
Most people making real decisions don't. So the case gets done badly on a spreadsheet, made on instinct, or sent to a bank or consulting firm at a steep price. Rigorous analysis has always been gated, by the team you staff or the firm you hire.
Why not a chat window with file upload
A chat tool ends in a reply. Kennan ends in the deliverable.
The work behind a real business case is hours of pulling numbers out of messy PDFs and Excel files, reading long filings, running a dozen web searches, and rebuilding the model for every scenario. Paste that into a chat window and you get a confident paragraph — no file it can hand you, no source you can click, a different answer on the next run.
Kennan does the work instead. The two sections below are one real agent run, captured: every tool call, every source, the model, the sensitivity grid, the export.
01·
Data
Pulls data out of PDFs, Excel files, and PowerPoint decks, uploaded or read straight from Box and Dropbox, and out of websites. Normalizes the result into clean, typed rows.
one agent run · 9m 56s · $10.20 · 40 sourced assumptions · exports to .xlsx and .pptx — ask a chat window for that
§ 1 · The workspace
Where the project lives, across sessions.
Projects on the left, the agent's working thread in the middle, your deliverables on the right — one workspace per piece of work. Pick up where you left off; scroll back through the agent's reasoning; hand the project to a colleague without losing the audit trail.
You
Build a forward operating-model for Klaviyo (NASDAQ: KVYO) covering FY26 through FY28.
Inputs to gather:
- Klaviyo's most recent annual 10-K (FY25)
- Most recent quarterly 10-Q
- Management guidance and any analyst-day disclosures you can locate
Build:
1. FY26 quarterly revenue forecast — by driver (customer count × ARPU × NRR walk).
2. Annual P&L for FY26 / FY27 / FY28: revenue → gross profit → S&M, R&D, G&A → operating income → adjusted EBITDA.
3. Net dollar retention se…
Kennan
I'll build this as a full operating model — data-dependent, action-ready per the brief. Since no documents are uploaded, I'll pull Klaviyo's filings and guidance from public sources.
**Quick note before starting:** Klaviyo's fiscal year is the calendar year, so as of now the most recent *annual* 10-K is FY24 (filed Feb/March 2025); FY25 is still in progress with FY25 quarterly 10-Qs available. I'll anchor on the FY24 10-K + latest FY25 10-Q + management guidance, and flag t…
query: Klaviyo Q3 2025 earnings revenue guidance FY2025 outlook
Web researchdone
query: Klaviyo net revenue retention NRR cohort disclosure 2024 2025
Web researchdone
query: Klaviyo customer count over $50k ARR mid-market enterprise segment
Kennan
Good — the timing check just clarified itself. Klaviyo's FY25 10-K was filed 02/10/2026 and Q1 FY26 results are already out ("28% growth, raised full-year outlook"). So we're building FY26–FY28 with FY25 as the actual anchor. Let me pull the specific filings.
I have enough data to build. Let me confirm the key anchors before I code:
**Actuals (locked from filings + PRs):**
- FY24 Revenue $937.5M (+34%), FY25 Revenue $1,237.5M (+32%), Q4 FY25 $350.2M (+30%)
- Q1 FY26 Revenue $358.0M (+28%), Non-GAAP OM 16% (record)
- Customers 196,000+ (Q1 FY26); $50K+ ARR cohort 4,175 (+38% YoY)
- NRR 110% at both Dec 31, 2025 and March 31, 2026 (up from 108% YoY)
**FY26 guide (raised at Q1):**
- Revenue $1,514–$1,522M (+23%)
- Non-GAAP OI $222…
Readdone
{"file_path":"/workspace/INDEX.md"}
Kennan
Good — computed 2026-07-02, so Q1 FY26 is the latest actual. Writing taxonomy, assumptions, and the model.
Done — model persisted cleanly. `10 metrics, 4 schedules, 10 narratives, 3 charts, 3 tables` across the Output, Summary, and Model Review surfaces.
**Base case (FY28E):**
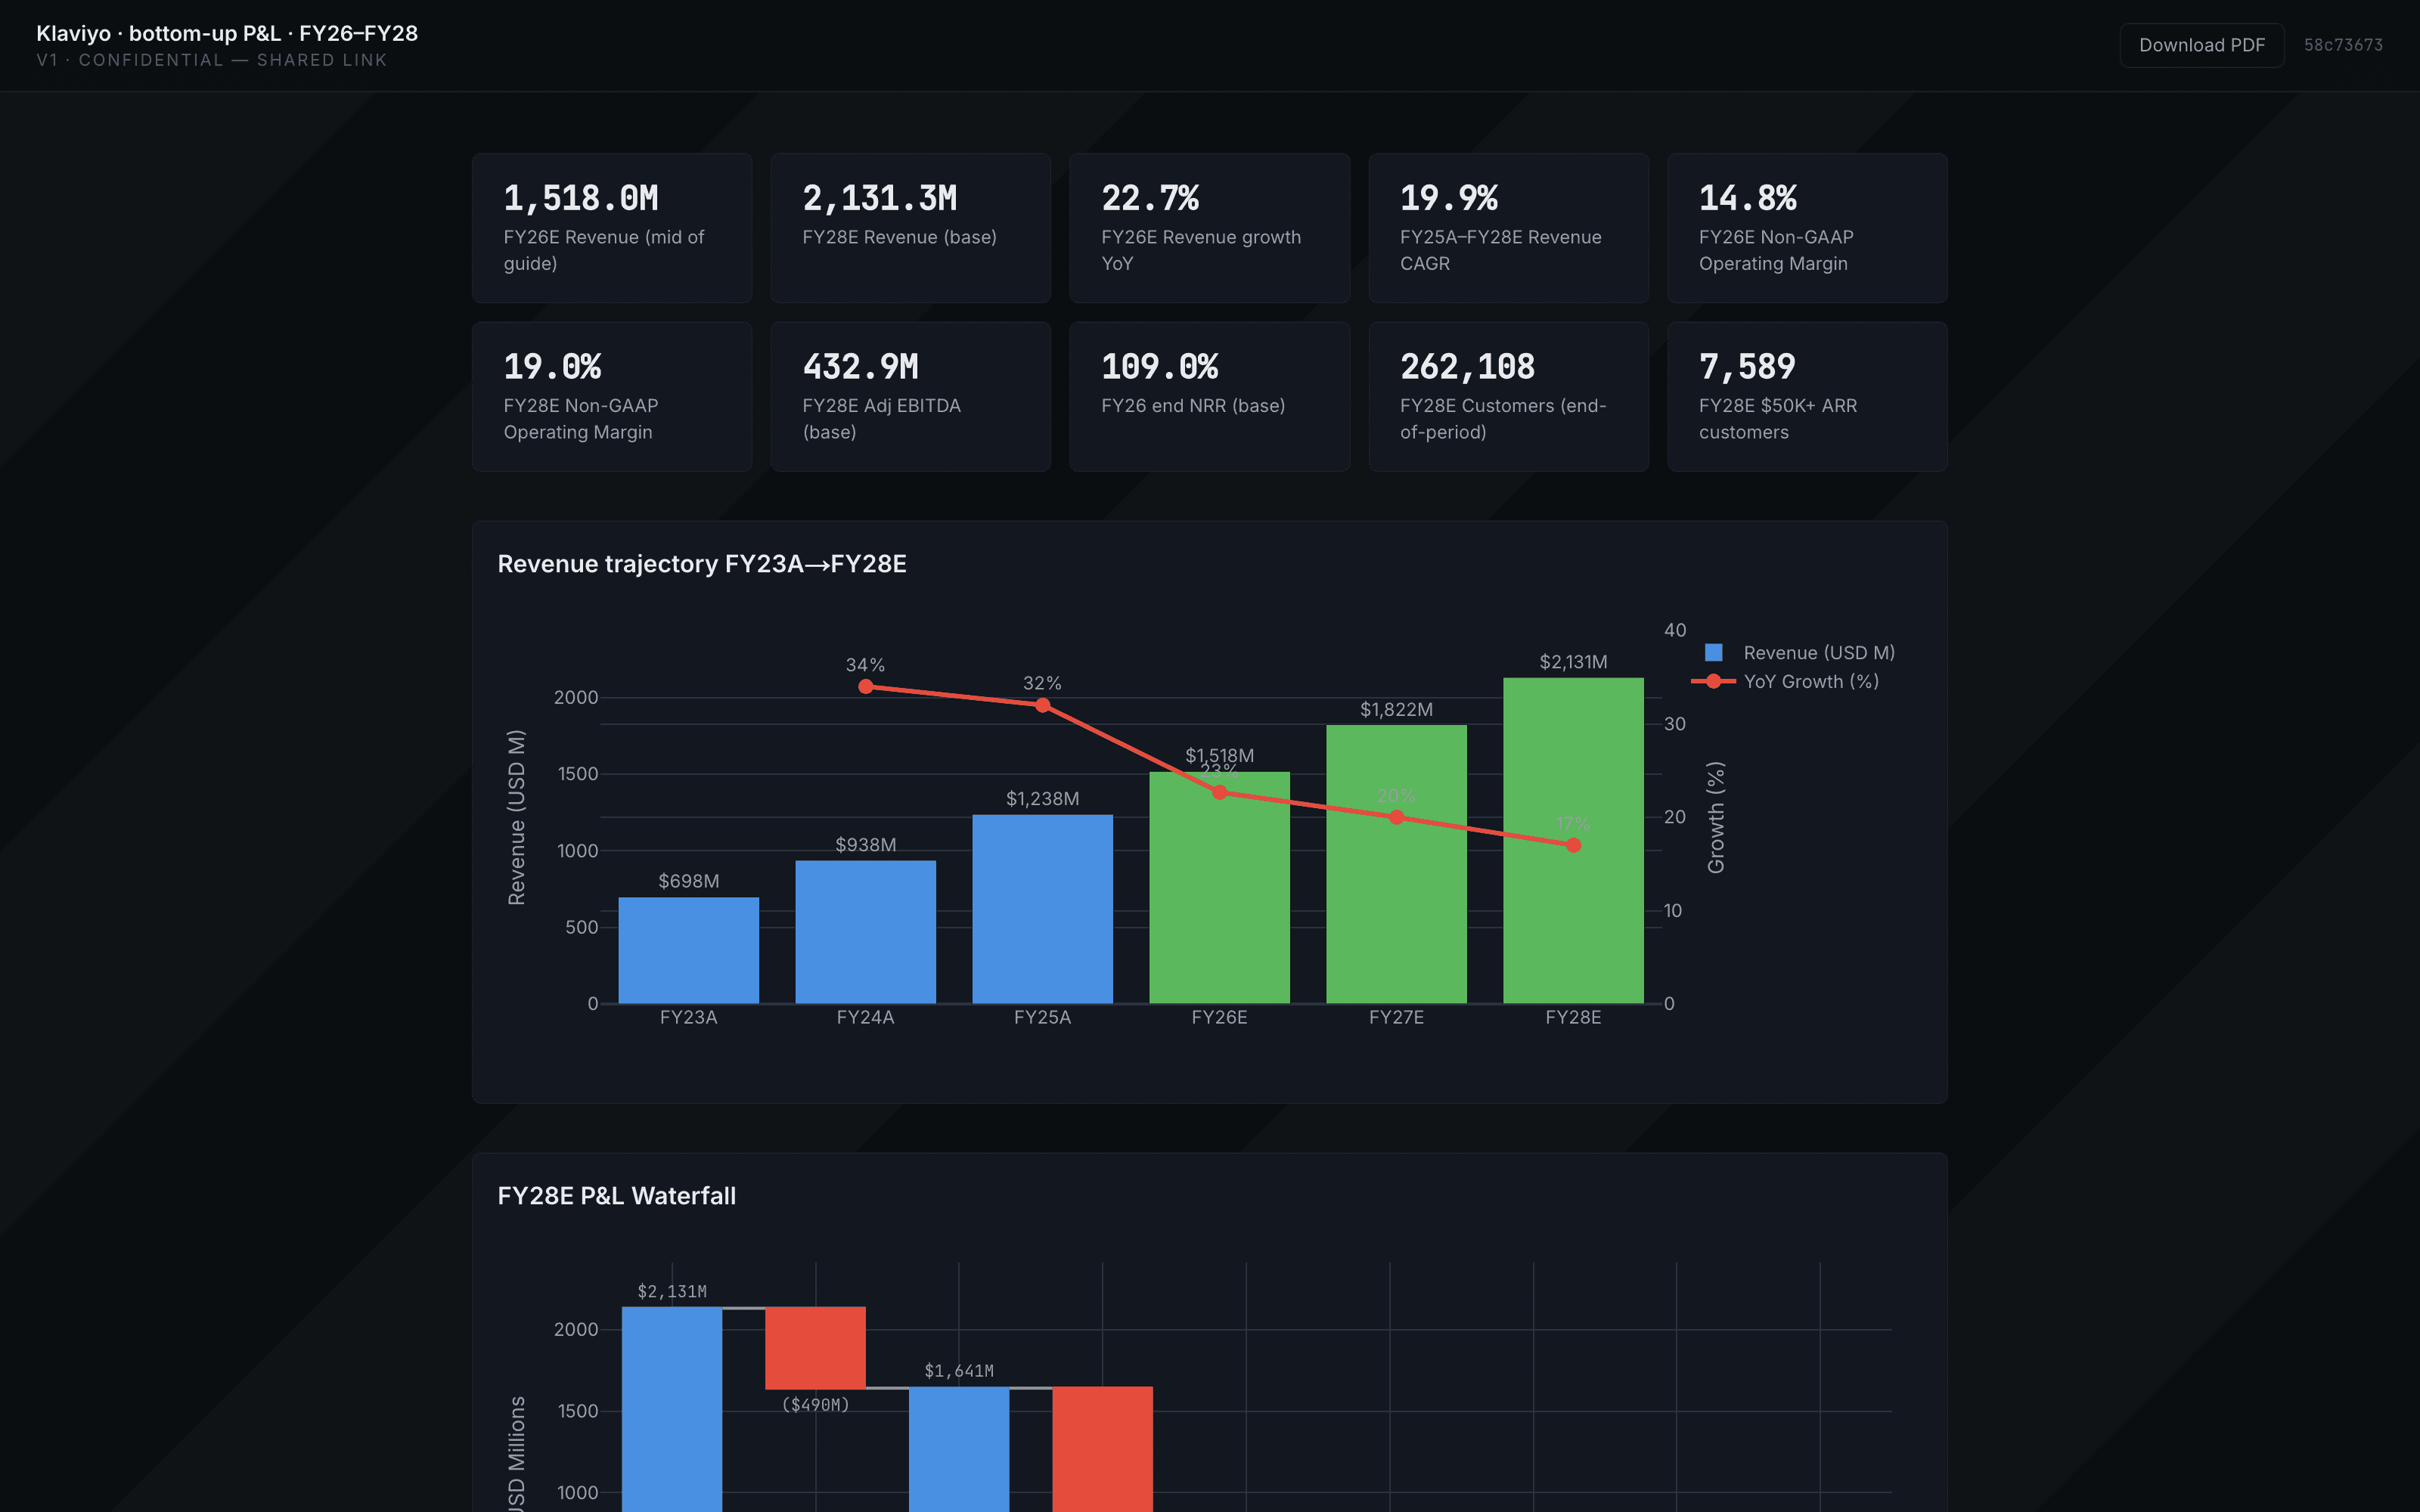
- Revenue **$2,131M** (19.9% FY25–FY28 CAGR)
- Non-GAAP OM **19.0%** (from 14.8% FY26 guide → within striking distance of 20%+ LT target)
- Adj EBITDA **$433M** (20.3% margin)
**NRR sensitivity range (FY28E revenue): $1,715M (100% NRR) → $2,814M (120% NRR)** — a $1.1B swing that dominates every other vari…
New analysis step…↥
OutputSummaryModel ReviewPresentExport ▾Share
FY26E Revenue (mid of guide)
$1.52B
FY28E Revenue (base)
$2.13B
FY26E Revenue growth YoY
22.7%
FY25A–FY28E Revenue CAGR
19.9%
FY26E Non-GAAP Operating Margin
14.8%
FY28E Non-GAAP Operating Margin
19.0%
FY28E Adj EBITDA (base)
$432.9M
FY26 end NRR (base)
109.0%
FY28E Customers (end-of-period)
262,108
FY28E $50K+ ARR customers
7,589
Revenue trajectory FY23A→FY28E
Revenue (USD M)YoY Growth (%)
FY28E P&L Waterfall
NRR Sensitivity — FY28E outcomes
FY28E RevenueFY28E Adj EBITDA
FY26 Quarterly Revenue Build — Drivers
Quarter
Revenue (USD M)
YoY Growth
Customers EOP
Impl. Quarterly ARPU (USD)
NRR
Q1 FY26 (A)
$0.0M
28.0%
196,000
$7,517
110.0%
Q2 FY26 (E)
$0.0M
23.2%
201,583
$7,263
110.0%
Q3 FY26 (E)
$0.0M
21.1%
207,167
$7,457
109.5%
Q4 FY26 (E)
$0.0M
19.4%
212,750
$7,965
109.0%
FY26 Total
$0.0M
22.7%
212,750
$7,633
109.0%
Annual P&L — FY25A–FY28E (Non-GAAP)
Line item
FY25A
FY26E
FY27E
FY28E
Revenue
1,237.5
1,518
1,821.6
2,131.3
Revenue growth YoY
0.3
0.2
0.2
0.2
Cost of revenue (non-GAAP)
303.2
364.3
428.1
490.2
Gross profit (non-GAAP)
934.3
1,153.7
1,393.5
1,641.1
Gross margin
0.8
0.8
0.8
0.8
Sales & Marketing
513.6
607.2
701.3
788.6
S&M % of revenue
0.4
0.4
0.4
0.4
Research & Development
179.4
212.5
255
298.4
General & Administrative
92.2
110.1
127.5
149.2
Operating income (non-GAAP)
149.1
223.9
309.7
404.9
Non-GAAP OM
0.1
0.1
0.2
0.2
D&A
18.5
22
25
28
Adjusted EBITDA
167.6
245.9
334.7
432.9
Adj EBITDA margin
0.1
0.2
0.2
0.2
NRR Sensitivity — FY28E Revenue & Adj EBITDA
NRR
Implied Annual Growth
FY28E Revenue (USD M)
FY28E Non-GAAP OM
FY28E Adj EBITDA (USD M)
FY28E Adj EBITDA Margin
100%
11.5%
$0.0M
0.2
$0.0M
17.6%
105%
16.5%
$0.0M
0.2
$0.0M
18.9%
110%
21.5%
$0.0M
0.2
$0.0M
20.3%
115%
26.5%
$0.0M
0.2
$0.0M
21.6%
120%
31.5%
$0.0M
0.2
$0.0M
23.0%
1. Executive summary
Thesis. Klaviyo is executing the SMB-to-mid-market pivot with mechanical precision — Q1 FY26 delivered 28% revenue growth AND a record 16% non-GAAP OM, disproving the growth-vs-margin trade-off that dominated the 2024-2025 narrative. The $50K+ ARR cohort is compounding at 38% YoY (nearly 2x total customer growth), driving structural mix shift up-market. Management raised FY26 guide at Q1; the path to 20%+ LT operating margin is now a 3-year, ~400bps-per-year exercise dominated by S&M leverage from a maturing GTM.
Base case: FY28E revenue $2,131M / Adj EBITDA $433M (20.3% margin). NRR…
2. Revenue drivers — customers × ARPU × NRR
FY26 Quarterly build:Growth decomposition — how NRR + new customers compose the 22.7% FY26 growth:
- Existing base retention (NRR = 110%): +10.0pp of growth from expansion within the FY25 cohort
- New customer acquisition: +12.7pp of growth from customers added in FY26
Mix shift up-market is the dominant ARPU driver. Total customers grow +15% in FY26; $50K+ ARR customers grow +35%. The $50K+ cohort scales from ~1.9% of customer count in FY25 to ~2.9% by FY28 — Klaviyo is becoming an enterprise CDP company that happens to have a large SMB base, not an SMB email company…
3. P&L summary
S&M is the operating leverage story. 40% → 37% of revenue is ~$300M of "found" operating income by FY28 that would otherwise be spent on sales headcount and marketing programs. R&D holds at 14% (Klaviyo is still investing in CDP, reviews, and service adjacencies); G&A modestly levers 7.2% → 7%.
GAAP reconciliation footnote: SBC runs ~18% of revenue → ~$273M in FY26. GAAP OI ≈ $-49M (~-3.2% margin) vs non-GAAP OI $224M. This spread narrows over time as SBC normalizes but remains the material GAAP-vs-non-GAAP delta.
4. Unit economics
Unit economics improve at scale. ARPU grows +16.7% over 3 years even as customer count grows +42%, because the mix shift toward $50K+ ARR customers is faster than SMB dilution. NRR at 107-110% (vs Klaviyo's SMB churn ~30%/year gross) means every dollar of net-new ARR compounds substantially. The rev/FTE ramp to $600K+ (+25% YoY) is the productivity signal that supports the S&M leverage thesis.
5. Key insights
1. Growth AND margin, not growth OR margin. Q1 FY26 delivered 28% revenue growth with 16% non-GAAP OM — the highest OM in Klaviyo's public history. This resolves the 2024-2025 debate over whether Klaviyo could compound past $1B while expanding margins. The answer, empirically, is yes.
2. Mix shift up-market is real and accelerating. $50K+ ARR customers grew 35%+ YoY vs total customers ~15% — the enterprise motion is now growing 2.5x faster than SMB acquisition. By FY28E, the $50K+ cohort represents ~2.9% of customer count but likely 60%+ of revenue.
**3. S&M leverage is the LT margi…
6. Levers
The three levers above capture ~80% of the model's variance. Toggle the NRR path to test bear/bull; toggle S&M % to test how much LT margin discipline management maintains under growth pressure; toggle FY27 growth to test the deceleration curve.
7. Methodology
- Revenue build: Q1 FY26 actual ($358.0M) locked; Q2 FY26 anchored on management guide midpoint ($361M); Q3/Q4 modeled using Klaviyo's historical seasonality (Q4 lift ~11% seq from Q3 driven by holiday SMS volume, usage-based pricing). Annual FY26 = sum of quarters, cross-checks to $1,518M guide midpoint.
- FY27/FY28 growth: Deceleration curve 23% → 20% → 17%. No management guidance beyond FY26; anchors are Klaviyo's own trajectory (34% → 32% → 23%E) and SaaS growth-at-scale precedent (Shopify at $2B revenue grew 18-22%; HubSpot 20-24%).
- NRR path: 110% Dec-2025 actual → modest d…
8. Scenarios
Range: $1,715M to $2,814M FY28 revenue — a $1.1B swing (~63% of the base case), which is why NRR is the single most important number to track in every future earnings print.
Risks that break the bear case further:
- SMB e-commerce macro — Klaviyo's SMB cohort skews DTC/Shopify; a severe consumer discretionary downturn hits this cohort hardest
- SMS/TCPA regulation — heightened consent enforcement could compress usage-based SMS revenue (currently ~15-20% of revenue)
- Shopify platform risk — Klaviyo remains the recommended email/SMS app in Shopify's ecosystem; any change t…
9. Rating
FY28E revenue $2,131M sits roughly in line with sell-side consensus (implied ~$2,050-2,150M from published growth trajectories); FY28E Adj EBITDA $433M is ~5-8% above street median driven by the S&M leverage assumption (40% → 37%). Base case is a beat-and-raise setup on margins, in-line on revenue.
10. Recommendation
Underwrite Klaviyo at base — the growth-and-margin combination is uncommon at this scale, and the NRR bull case (115%+) is materially under-priced by the market versus what the $50K+ cohort trajectory implies.
Live capture · Klaviyo · bottom-up P&L · FY26–FY28 · agent run on Jul 2, 2026 · 9m 56s end-to-end
The real page, not a mockup — captured from app.kennan.ai. This exact workspace is public.
Answer the “what if” before the meeting ends, not in a follow-up two days later.
Every IC review hits the same wall: someone asks “what if NRR comes in at 105% instead of 110?” and you take it offline, flip between three Excel versions, and email the answer Tuesday. With Kennan, the sensitivity is already on the deliverable — emitted by the same stored Python program as the base case, in one run.
kennan / klaviyo · bottom-up p&l fy26-fy28NRR 110% · base case
Every number on screen came out of the captured KVYO run · the slider walks the five rows the program emitted in one shot.
What changes
Days of work, done in an afternoon.
Kennan does the setup work an analyst would do and hands back the business case. The hours that used to disappear into reconciling and rebuilding go back into the part that was always the point: the thinking.
Today
With Kennan
Days reconciling sales, marketing, payroll, and accounting
→Clean data in hours, every figure tracing back to where it came from
A driver-based revenue model rebuilt for every scenario
→One model, every scenario running off it, recalculated in seconds
The deck rebuilt by hand each time the story changes
→The presentation drafts itself from the model, charts included
“Let me come back to you”
→The revenue question answered while the meeting is still going
A team you staff, or a firm you hire
→An analyst seat you can pull up whether or not you have a team
Analysts get the week back and spend it on thinking. The people who never had an analyst get one for the first time. The decision gets made sooner, on numbers that hold.
Rigorous business casing, without the team or the firm.
Connect a Box or Dropbox account once. Kennan searches the folders, pulls the files a piece of work needs, and reads them into the workspace. Nobody downloads a data room to upload it again.
01 · Diligence
The seller’s data room
Buy-side and corporate development teams point Kennan at the room. It lists the folders, pulls the CIM, the management accounts, and the quality-of-earnings report, and builds the model and the IC memo from them.
02 · Finance
The team’s shared folder
The monthly management pack, the budget files, last quarter’s board deck. Kennan reads them from the folder the team already saves to, instead of a fresh upload every cycle.
03 · Advisory
The client’s documents
The files a client shares for a CIM or a pitch book, read where the client put them. Each assumption in the model traces to the file and the folder it came from.
Read-onlyKennan cannot edit, move, delete, or share anything in your Box or Dropbox.
SourcedEvery pulled document records the folder it came from and the date it last changed there.
CurrentPull a revised file and the workspace links it to the earlier copy, so figures re-read from it cite the newer one.
Kennan can pull any file your account is allowed to download; a folder shared with preview-only access stays out of reach. Connect an account under Settings › Data Sources. Plans that include connectors →
Security
Confidential by construction.
The deal that isn’t public yet is safe here. The two questions every desk asks us — answered plainly, with the specifics behind each.
Your data stays yours.
Every document is isolated to your organization and encrypted end to end. Nothing is pooled, shared, or visible across clients — not to another customer, not to us.
ISOLATED PER ORGKERNEL-LEVEL SANDBOXENCRYPTED IN TRANSIT & AT REST
Never used to train AI.
Your files and the agent’s outputs go to an AI vendor only to do the work you asked for, and are never used to train a model — ours or any vendor we route through.
NO MODEL TRAININGEVERY VENDOR NAMED
So yes — upload the confidential deck.
The CIM, the board pack, the model that isn’t public yet. This was built for exactly that work, not adapted to tolerate it.
Read the full security overview →Built on Google Cloud (ISO 27001 · SOC 2 · FedRAMP substrate) · SOC 2 Type II program underway, interim packet under DPA
$30, $120, or $300 per seat. Enterprise on contract.
Each seat includes monthly usage, pooled across your team — priced against the analyst-week it returns, not the chat window it replaces. Run over in a busy month and top up in dollars, in seconds. See pricing →
VZ
Victor Zhang · FounderNYC · 2026
Built by an analyst
Built by an analyst who lived in this workflow for ten years.
Ten years in corporate finance, M&A, and asset management: capex and corporate-finance work for Fortune 500 management, lead analyst on closed M&A deals, then principal at a family office deploying $100M+ across PE and venture. Sectors touched: banking, real estate, technology.
The product is being built around what the work demands rather than around what looks impressive in a demo. If you've sat through an IC review, the workspace should feel familiar. If you haven't, the manifesto is a better introduction than this card.